Viewing nearest neighbors
Kent Johnson
2022-01-03
Source:vignettes/spatial_map_viewer.Rmd
spatial_map_viewer.RmdOverview
The “Spatial map viewer” addin allows viewing of nearest neighbor and touching relationships between cells of selected phenotypes in a single field. Views can be saved for later use.
Data requirements
Consolidated data file
This addin reads data from the Consolidated_data.txt file created by the “Consolidate and summarize” addin. It can also use the nearest_neighbors.txt or count_within.txt file created by the “Analyze consolidated data” addin when “Save nearest neighbor / count within details” is selected.
Composite and component image files
The viewer uses both composite and component image files for the fields of interest. These files are written by the inForm export step.
The composite images are shown as the background of the nearest neighbor visualizations. The colors and components shown are determined by the inForm export settings.
The component images are the source of metadata about fields that is needed to properly places cells in the visualizations.
Detailed steps
Start the spatial map viewer
Choose “Spatial map viewer” from the RStudio Addins menu to start the viewer.
Select input files
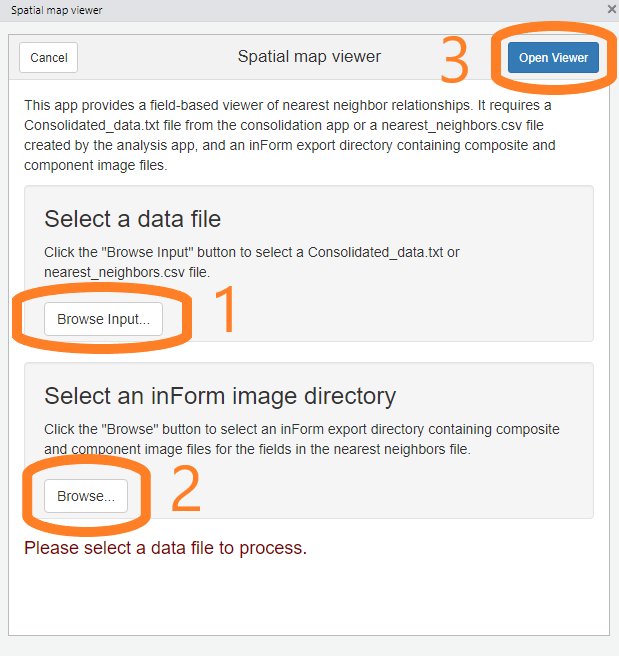
The viewer’s initial screen allows you to select the nearest neighbor file and inForm export directory containing the fields of interest.
First, click the “Browse input” button and select a
Consolidated_data.txtfile from the “Consolidate and summarize” addin or anearest_neighbors.txtorcount_within.txtfile created by the analysis addin.Next, click the second “Browse” button and select the inForm output directory corresponding with the data file.
Finally, click “Open Viewer” to start the viewer.
Nearest neighbor viewer
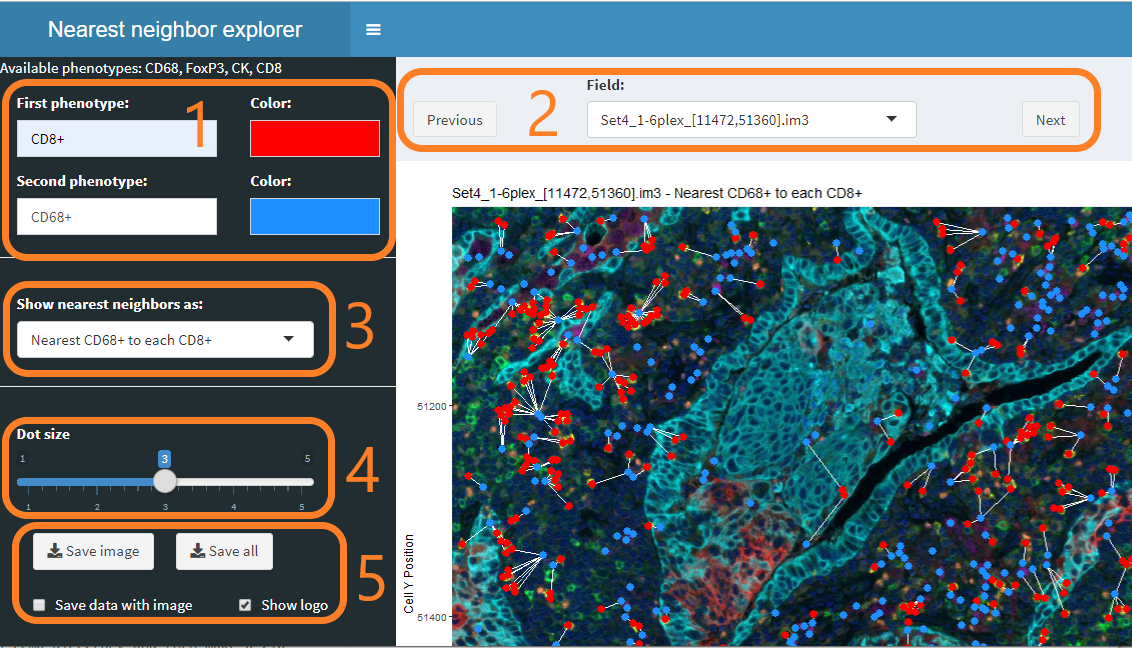
The nearest neighbor viewer allows you to
Select and color phenotypes In this section, select the two phenotypes of interest and the colors to use to display the phenotypes. Both single phenotypes such as
CD8+and multiple phenotypes such asCD8+/PDL1+are supported.Select a field to view Use the dropdown to select a particular field, or use the Previous and Next buttons to browse through all the fields.
Select the type of nearest neighbor relationship “Nearest neighbor” is not a symmetric relationship—cell A may have a nearest neighbor B, whose nearest neighbor is not A. Try the different settings to find the one you want.
Control the dot size This slider controls the size of the dots displaying the cells. You may want to make the dots smaller before saving images.
-
Save a single view or views for all fields The “Save image” button will save the currently displayed image in your browser’s Download folder. The “Save all” button will use the current settings to save a directory or zip file containing images of all fields in the experiment.
- Select “Save data with image” to save a tab-separated data file with the image(s).
- Select “Show logo” to include the Akoya Biosciences logo in the image(s). Deselect to show or save images without the logo.
Format of saved data files
If “Save data with image” is selected, a tab-separated data file is saved with the image(s). The data file contains one row for each pair of connected cells, i.e. the cells that are connected with a white line segment in the images.
- If “Save image” is clicked, the file will include data for the single image.
- If “Save all” is clicked, a single data file will be created with data for all images.
In either case, the columns in the file will be
- Slide and field identifiers
- Cell ID and location for both cells in the pair
- Distance to the “nearest” cell